

Most home service KPI lists give you twenty metrics and no order of operations. This one gives you eight, sequenced by which to fix first, starting with the number most lists leave out entirely: what percentage of your inbound calls actually get answered.
There is a specific failure mode in home service management. The owner reads a KPI article, builds a dashboard with eighteen metrics, checks it enthusiastically for three weeks, and then stops. The dashboard was not wrong. It was just undifferentiated, eighteen numbers with no indication of which one to act on Monday morning.
So this list is short, and it is ordered. Work down it.
Leading vs. lagging: why the order matters
Metrics split into two kinds, and most lists mix them together without saying so.
- Lagging indicators report what already happened: revenue, profit, jobs completed. They are essential for knowing where you stand and nearly useless for deciding what to do tomorrow, because by the time they move, the causes are weeks behind you.
- Leading indicators predict what is about to happen: answer rate, speed to lead, booking rate. Move these and the lagging numbers follow.
The eight below run roughly from leading to lagging. That is deliberate, because the top of the list is where you can actually intervene.
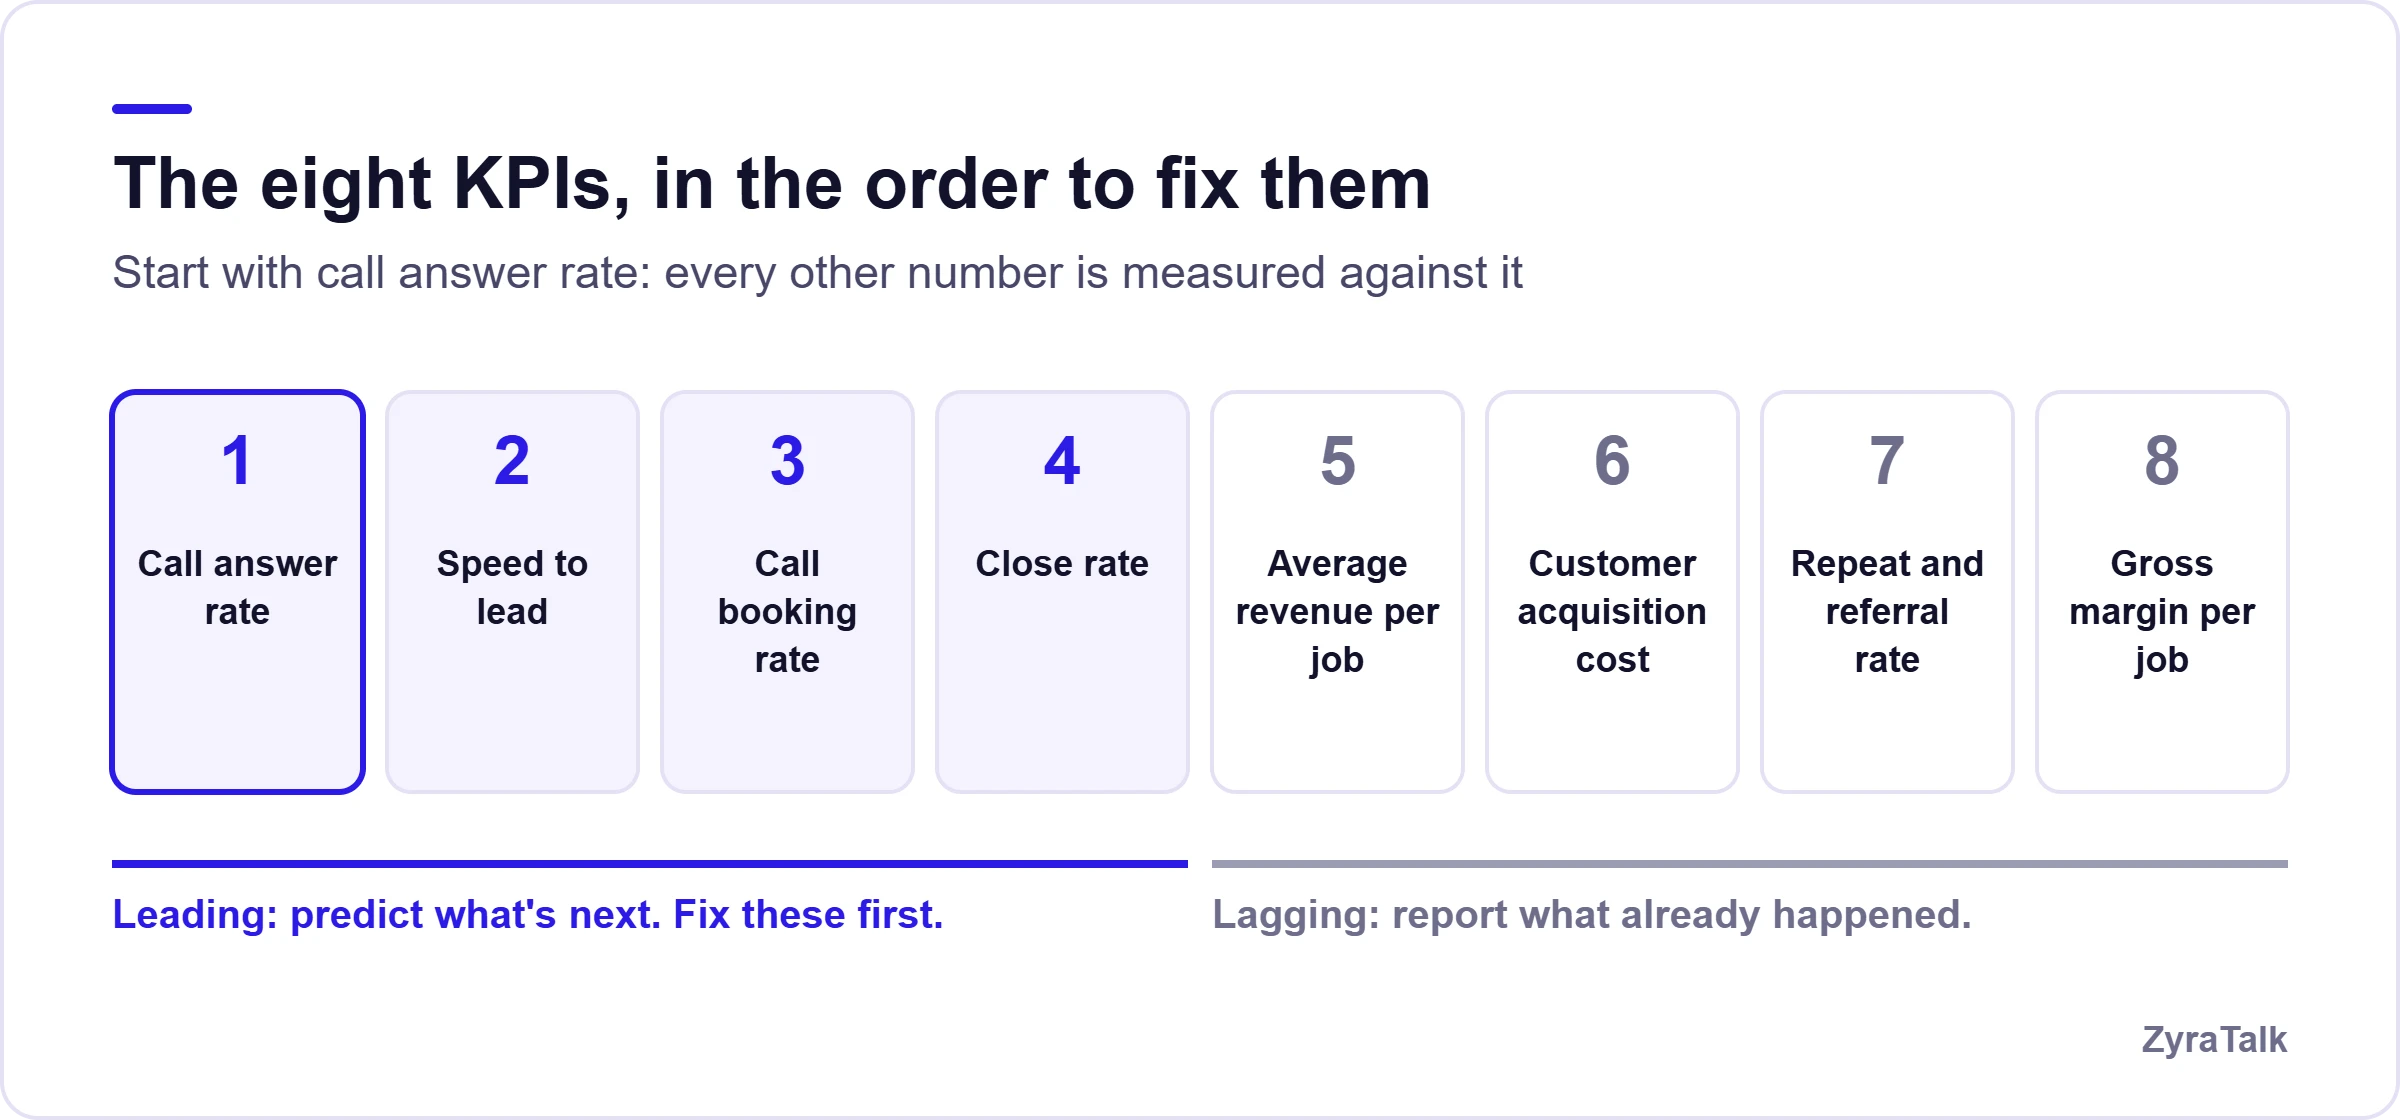
1. Call answer rate
What it is: the percentage of inbound calls that reach a human, or an AI receptionist that can actually help, rather than ringing out to voicemail.
Why it is first: because every other number on this list is calculated on the leads that got through. Your close rate is measured against answered calls. Your average ticket is measured on booked jobs. If you answer 70% of your calls, you are not running your business at 70% capacity. You are measuring the performance of 70% of your demand and treating it as the whole picture.
This is the metric missing from essentially every competing KPI list, and it is missing for a structural reason: field service platforms report on jobs, and a call that never became a job never entered the system. The data lives in your phone records, not your field service software.
Benchmark: aim as close to 100% as coverage allows. Small field businesses commonly run 60–80% without realizing it. Pull thirty days of carrier call logs and check before assuming yours is fine.
2. Speed to lead
What it is: how long it takes to respond to a new inquiry, whether that is a call, a form or a text.
Measure time to live contact, not time to first attempt.
Why it matters: homeowners call several contractors in one sitting. The window is minutes. The foundational research, from a 2007 MIT and InsideSales study of more than 15,000 leads, found the odds of qualifying a lead drop sharply between five and thirty minutes, and in the trades the practical target for phone leads is answering live.
Benchmark: phone calls answered live; form and text leads responded to inside five minutes during business hours.
3. Call booking rate
What it is: the share of answered calls that end in a booked job.
Why it matters: this measures the quality of the conversation itself. A low booking rate on healthy call volume points at how calls are handled: hold times, whoever answers not being able to see the schedule, no answer on ballpark pricing.
Benchmark: varies by trade and lead source. Emergency-heavy trades book a higher share than quote-driven ones. Track your own trend rather than chasing someone else's figure.
4. Close rate
What it is: the percentage of quotes or estimates that convert into sold work. Distinct from booking rate, because booking gets the truck to the house and closing gets the job sold.
Why it matters: for any trade doing quoted work, including roofing, HVAC replacement and remodeling, this is where margin is won or lost. Two techs with the same lead flow and a fifteen-point close-rate gap represent a large annual difference in revenue from identical marketing spend.
Benchmark: genuinely trade-dependent. Service calls with a clear diagnosis close very high; competitive bid work considerably lower. Published third-party benchmarks for this metric are unreliable, so track by technician as well as in aggregate. The spread between your best and worst closer is usually the most actionable number in the business.
5. Average revenue per job
What it is: average ticket, meaning total revenue divided by number of jobs.
Why it matters: it is the multiplier in nearly every other calculation you will run, including what a missed call costs you and whether your customer acquisition cost is sustainable. It also responds to management: the same job list produces a different average depending on whether techs are presenting options, catching adjacent issues and offering maintenance plans.
How to use it properly: segment it. A blended average across emergency calls, maintenance visits and full replacements is a number that describes none of them. Break it out by job type and lead source and you will usually find one channel producing volume at a ticket that does not justify its cost.
6. Customer acquisition cost
What it is: what it costs, all in, to land one new customer.
Why it matters: it is the check on every marketing decision. Without it, channel decisions get made on impressions and gut feel.
How to use it properly: calculate it per channel, not just blended. Blended CAC hides the fact that referrals are nearly free while shared-lead marketplaces may be running at a loss. And compare it against lifetime value rather than against a single ticket, because a $400 CAC on a one-off job is very different from a $400 CAC on a customer who signs a maintenance plan.
7. Repeat and referral rate
What it is: the share of revenue coming from existing customers and their referrals rather than paid acquisition.
Why it matters: it is the closest thing to a free growth channel, and it compounds. It is also the metric that reveals whether your paid acquisition is filling a bucket with a hole in it, since high spend paired with a low repeat rate means you are renting customers rather than keeping them.
Practical note: this requires actually asking how customers found you and recording the answer. Most businesses that cannot report this number simply are not capturing lead source at intake.
8. Gross margin per job
What it is: revenue minus direct job costs such as labor, materials and subs, expressed as a percentage.
Why it matters: revenue growth with flat margin is just more work for the same money. This is the number that tells you whether you are pricing correctly and whether specific job types are worth taking at all. Most owners discover at least one service line they have been running at or below break-even out of habit.
The eight in one table
| # | KPI | Formula | Type |
|---|---|---|---|
| 1 | Call answer rate | Answered ÷ total inbound calls × 100 | Leading |
| 2 | Speed to lead | Total response time ÷ number of leads | Leading |
| 3 | Call booking rate | Jobs booked ÷ calls answered × 100 | Leading |
| 4 | Close rate | Jobs sold ÷ estimates given × 100 | Leading |
| 5 | Average revenue per job | Total revenue ÷ jobs completed | Lagging |
| 6 | Customer acquisition cost | (Sales + marketing spend) ÷ new customers | Lagging |
| 7 | Repeat and referral rate | Repeat and referral jobs ÷ total jobs × 100 | Lagging |
| 8 | Gross margin per job | (Revenue − direct cost) ÷ revenue × 100 | Lagging |
How to actually start
Do not build the dashboard first. Do this instead:
1. Pick one number from the top three. Almost always call answer rate, because most owners have never measured it and the result is usually a surprise.
2. Measure it for thirty days. Carrier call logs, or call tracking software if you have it.
3. Fix what the data points at. Segment by hour and day and the fix usually names itself: after-hours coverage, or a second line during peak.
4. Then add the next metric. One at a time. A tracked metric that changes behavior beats eight tracked metrics that decorate a spreadsheet.
How ZyraTalk helps
ZyraTalk sits on the first three KPIs on this list. It answers every inbound call, including nights, weekends and multiple calls at once during peak season, which pushes answer rate toward 100% and makes speed to lead effectively instant for phone leads. It qualifies callers and books jobs directly into your field service software, which lifts booking rate, and it logs every call with a transcript so you finally have reliable data on the top of the funnel rather than an estimate.
Eight numbers, in order, with the leading indicators first. If you only ever track one, track the percentage of your phone calls that get answered, because every other number on this list is quietly measured against it.
Start with the number you've never measured
ZyraTalk logs and transcribes every call for HVAC, plumbing, electrical, cleaning and painting businesses, so answer rate, speed to lead and booking rate stop being estimates.
Book a demo- Answer rate toward 100%
- Instant response on phone leads
- Real top-of-funnel data, not guesses
Home service KPI FAQs
Which KPI should a home service business track first?
Call answer rate. Every other number on the list is measured against the calls that got through, and most owners have never measured it. Pull thirty days of carrier call logs to find your baseline before adding anything else.
What is a good call answer rate?
As close to 100% as your coverage allows. Small field service businesses commonly run 60–80% without realizing it, so check your carrier call logs before assuming yours is fine.
What is the difference between leading and lagging KPIs?
Lagging indicators, such as revenue, profit and jobs completed, report what already happened. Leading indicators, such as answer rate, speed to lead and booking rate, predict what is about to happen. Move the leading numbers and the lagging ones follow.
How fast should you respond to a new lead?
Answer phone calls live. For form and text leads, respond within five minutes during business hours. Measure time to live contact, not time to the first attempt.
How do you calculate call booking rate?
Divide jobs booked by calls answered and multiply by 100. A low booking rate on healthy call volume usually points at how calls are handled, such as hold times or whoever answers not being able to see the schedule.
How many KPIs should a home service business track?
Start with one. Measure it for thirty days, fix what the data points at, then add the next metric. A tracked metric that changes behavior beats eight that decorate a spreadsheet.